

Series: 2026 Bond Market Crisis
What the 10-Year Treasury Is Really Telling Us
This is Part 1 of a three-part deep dive into the 2026 Treasury yield surge — what’s driving it, how Washington is responding, and who gets hurt if it continues. Part 2 covers the Treasury’s buyback gambit and the historical playbook for bond-market discipline. Part 3 covers the fallout for stocks, the AI trade, and what investors should actually do.
Every few years, the bond market stops being background noise and starts being the main event. We’re in one of those moments now.
As of late August 2026, the 10-year U.S. Treasury yield is trading around 4.7%, after touching a 20-month high near 4.75% earlier in the week. The 30-year bond briefly broke above 5.3% — a 19-year high. In a Bloomberg Markets Pulse survey of nearly 400 market professionals conducted this month, two-thirds said they expect the 10-year to break decisively above 5% before year-end, territory the market has scarcely visited since 2007, on the eve of the global financial crisis.
This piece is about why that matters more than almost anything happening in equities right now — and why the standard explanations (a hot economy, sticky inflation) don’t fully capture what’s going on.
Why the “boring” long end of the curve is the one to watch

Financial media spends most of its energy on the Federal Reserve’s overnight policy rate — will they cut, will they hold, will they hike. That’s understandable; it’s the number the Fed controls directly, and it gets a headline eight times a year. But the overnight rate mostly governs short-term borrowing: credit cards, some floating-rate loans, bank funding costs.

The number that actually shapes long-horizon economic decisions is different. It’s the yield on 10-year and 30-year government bonds, and it sits largely outside the Fed’s direct control — it’s set by the market’s collective judgment about growth, inflation, and, increasingly, credit risk over the next decade or three.
Here’s why it matters so much in practice:

Corporate capital projects. When a hyperscaler decides to build a new data center, or an airline finances a new fleet, the project’s returns get discounted using rates tied to the long end of the curve. Multi-year projects are highly sensitive to small moves here — a half-point rise in the discount rate can meaningfully shrink a project’s calculated net present value.
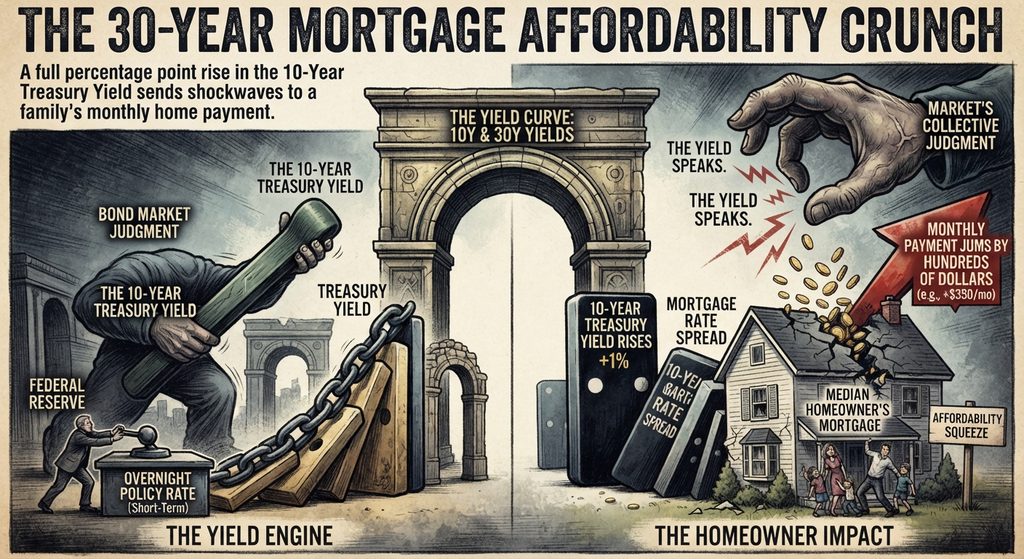
The 30-year mortgage. The rate that determines whether a family can afford a home is priced almost directly off the 10-year Treasury yield plus a spread. When the 10-year rises a full percentage point, monthly mortgage payments on a median home can jump by hundreds of dollars.

The entire bond market’s asset base. Trillions of dollars sit in pension funds, insurance portfolios, and bond mutual funds that are priced off this curve. When long yields move sharply, those portfolios reprice in real time — and because equities are ultimately valued as a stream of future cash flows discounted at a rate influenced by the “risk-free” long bond yield, stock valuations move too.
Short rates and long rates typically move in the same direction, but it’s the long end that does the heavy lifting in terms of real economic consequences. That’s the part of the curve sending an unusually loud signal right now.
It’s not a boom, and it’s not runaway inflation — at least not in the classic sense
The intuitive read on rising rates is: the economy is running hot, so rates go up. That’s not really the story in 2026.

U.S. growth data has been mixed rather than exuberant. Inflation is elevated, but the dominant driver has been a supply shock, not demand-side overheating: an escalating conflict involving Iran has pushed oil prices sharply higher through the year, feeding directly into energy and transport costs. West Texas Intermediate crude started 2026 near $57 a barrel, spiked to roughly $113 in April amid the conflict, fell back, and has been volatile since — with some Fed-linked analysis warning it could climb toward $120 if blockades in the region persist.

That’s genuinely moved Fed policy expectations — but in a jagged, on-again-off-again way that reflects how much of this is geopolitical rather than structural. As recently as late July, futures markets were pricing in roughly a one-in-three chance of a Fed rate hike by the September meeting. By mid-August, as oil climbed further and a hot inflation reading landed, those odds had — at various points — spiked as high as 80%, before easing back into the 50% range as softer labor-market data cooled the urgency. Fed Chair Kevin Warsh has held the policy rate steady through the summer, in a 3.50%–3.75% range, over the dissent of several regional Fed presidents who have pushed for an immediate hike.
The nuance matters: a September hike is a live possibility, not a settled call — and it’s being driven by an energy-price shock layered on top of an already-elevated inflation backdrop, not by a textbook consumption-and-investment boom. That distinction is exactly why the inflation story alone doesn’t explain the scale of the move in long-term yields.
The signal underneath the noise: a credit-risk premium on the government itself

Strip out the inflation headlines, and a more uncomfortable explanation emerges. Interest rates are, at bottom, the price of borrowed money. That price reflects two things: how much money is being demanded, and how creditworthy the borrower is perceived to be. Lenders charge riskier borrowers more, whether that borrower is a small business or a sovereign government.
What appears to be happening in 2026 is the second effect dominating the first. Bond investors are not primarily worried about an overheating U.S. economy. They’re increasingly worried about the trajectory of U.S. government borrowing itself — and they’re demanding a higher rate to keep financing it.

Crucially, this isn’t a uniquely American phenomenon. Long-term yields have risen in tandem across the United Kingdom, Germany, and Japan over the same period — three economies whose main shared characteristic isn’t overheating growth, but large, persistent fiscal deficits. In several cases, that fiscal pressure has been compounded by the cost of prolonged military engagement tied to the Middle East conflict: more weapons procurement, more logistics spending, wider budget gaps. The bond market, in effect, appears to be pricing a broader “fiscal risk premium” across the developed world — not a U.S.-specific story, even if the U.S. is the largest and most closely watched example.
Setting up Part 2
If the bond market is delivering a warning about fiscal sustainability, the obvious next question is: how is Washington responding? In late August, the U.S. Treasury moved to at least double the size of its long-maturity bond buyback program — a step explicitly designed to push yields back down. It didn’t work the way anyone hoped. Part 2 breaks down exactly why, using the sharpest recent case study of what happens when a government tries to out-argue the bond market: the UK’s Liz Truss episode of 2022, and the deeper structural shift in how central banks and governments have inserted themselves into markets since 2008.
Continue to Part 2: “The Treasury’s Band-Aid, and the History of Bond Market Discipline.“
Series: 2026 Bond Market Crisis