
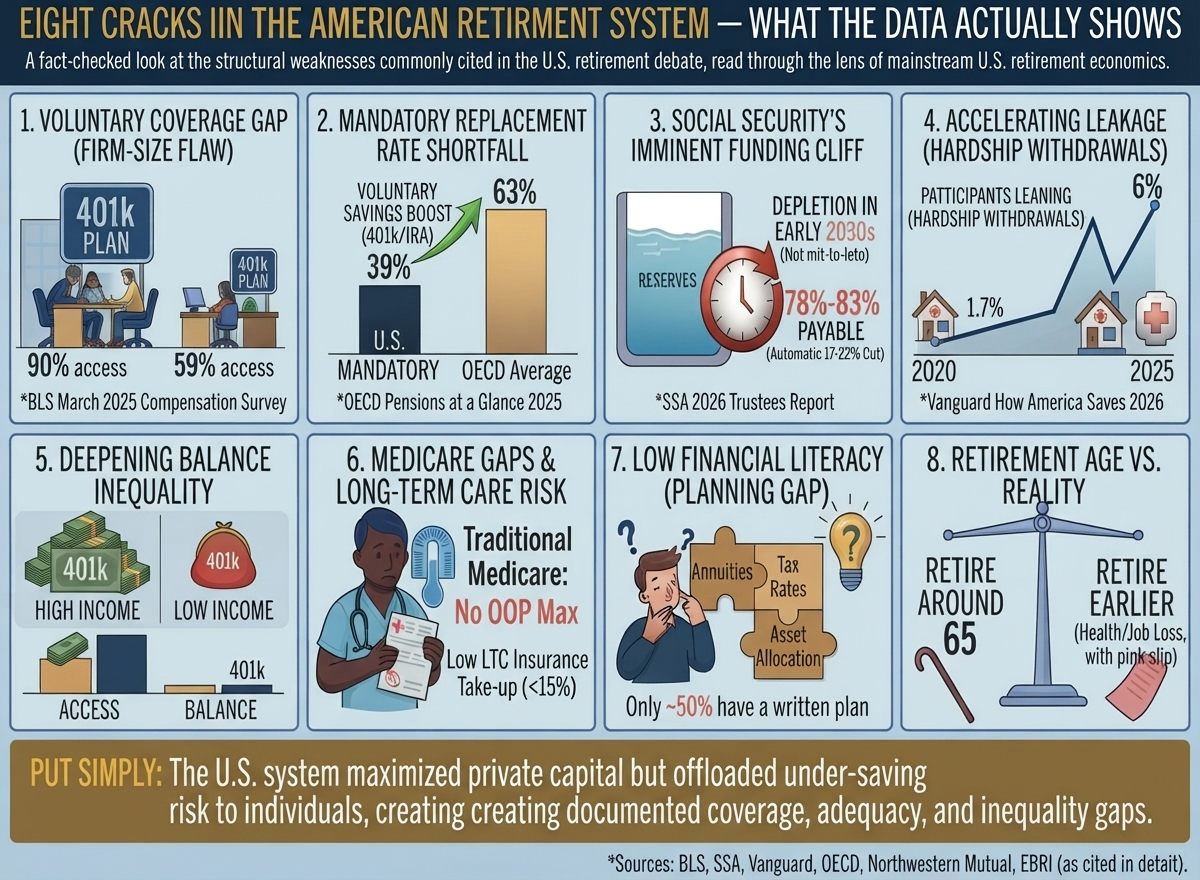
What the Data Actually Shows
A fact-checked look at the structural weaknesses commonly cited in the U.S. retirement debate, read through the lens of mainstream U.S. retirement economics.

The list of complaints about cracks in the American retirement system is familiar: too voluntary, too unequal, too exposed to Social Security’s funding math. Most of the individual data points behind that list hold up well under scrutiny — the numbers below are checked against BLS, SSA, Vanguard, OECD and Northwestern Mutual primary sources. What a Western economist would push back on is not the facts, but the framing: several of these “problems” are the flip side of design choices — flexibility, portability, capital-market exposure — that also explain why the U.S. simultaneously has the deepest retirement-asset pool in the world.
1. A Voluntary System, With a Real Coverage Gap
This claim checks out, with the important nuance that it is not really a national number — it’s a firm-size number. According to the Bureau of Labor Statistics’ March 2025 National Compensation Survey, only 59% of employees at firms with fewer than 100 workers have access to a workplace retirement plan, versus 90% at firms with 500 or more employees. Overall private-sector access sits at 72%, and actual participation — access plus opt-in — comes to 53–56%, roughly matching the “about 60%” figure commonly cited.

Economist’s read: This is the single largest structural gap between the U.S. and top-ranked systems like the Netherlands or Australia, both of which mandate participation regardless of employer size. It is a coverage design flaw, not a capital markets flaw — the fix (state-run auto-IRA programs, federal auto-enrollment mandates for new plans under SECURE 2.0) is already underway but partial.
2. Replacement Rates: Correct, But Needs a Caveat
The claim that Social Security alone replaces “around 40%” of pre-retirement income for an average earner is accurate — OECD’s Pensions at a Glance 2025 puts the U.S. mandatory-scheme net replacement rate at roughly 39%, well below the OECD mandatory-scheme average (~63%). That part of the claim is correct and worth taking seriously.
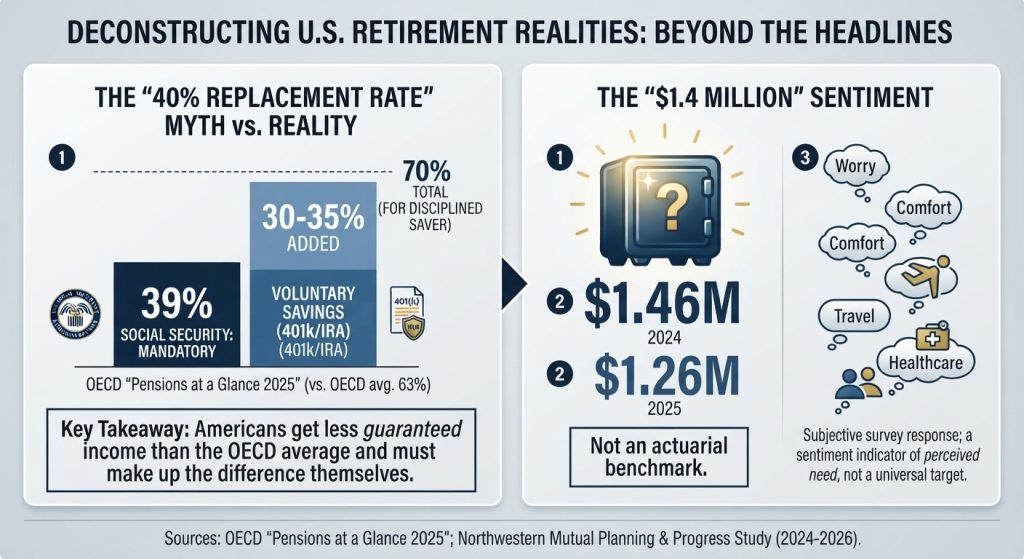
Where the framing needs balance: the OECD’s same analysis finds that voluntary savings (401(k)/IRA) add more to the U.S. replacement rate than in almost any other member country — an estimated 30–35 percentage points — pushing the effective total for a disciplined saver closer to 70%. The honest statement isn’t “Americans get less than the OECD average,” it’s “Americans get less guaranteed income than the OECD average, and must make up the difference themselves — which most manage only partially.”
On the “$1.4 million” figure: this is a real, frequently cited number, though it moves around by survey year — Northwestern Mutual’s Planning & Progress Study put the “needed for a comfortable retirement” figure at $1.26 million in 2025 and $1.46 million in both 2024 and 2026. It is a subjective survey response, not an actuarial benchmark, and should be read as a sentiment indicator rather than a target number.
3. Social Security’s Funding Cliff Is a Real Crack in the American Retirement System

This is the one claim worth correcting outright. The Social Security Administration’s own 2026 Trustees Report (the most recent available) projects that the OASI (retirement) trust fund alone will be depleted in the fourth quarter of 2032 — not the “mid-to-late 2030s.” At that point, incoming payroll tax revenue would cover about 78% of scheduled benefits, an automatic 22% cut. If Congress allows the retirement fund to draw on the disability fund, the combined reserves last until 2034, at which point 83% of benefits remain payable (a 17% cut). Either way, this is inside the next decade, not two decades out.

Economist’s read: This is the most consequential and most under-discussed number in U.S. retirement policy. It is a legislated, not a hypothetical, cliff: current law requires benefits to be cut automatically to match incoming revenue once reserves run out — there is no default mechanism for continued borrowing. Nearly every mainstream retirement economist (across the Committee for a Responsible Federal Budget, the Center for Budget and Policy Priorities, and the Bipartisan Policy Center) treats this as the top near-term policy risk, distinct from — and larger than — any private-savings shortfall.
For what this means for your own claiming strategy, see Part 4’s breakdown of the delayed retirement credit.
4. “Leakage”: Confirmed and Accelerating
This claim is fully supported by the data, and arguably understated. Vanguard’s How America Saves 2026 report — covering nearly 5 million defined-contribution participants — found that 6% of participants took a hardship withdrawal in 2025, the highest share on record, up from 4.8% in 2024 and roughly 1.7% in 2020. The most common reason cited was avoiding home foreclosure or eviction, followed by medical expenses.

Economist’s read: This trend matters more than its small headline percentage suggests, because hardship withdrawals concentrate among lower-balance accounts early in the accumulation phase — exactly the money that benefits most from decades of compounding. It is also a useful real-time gauge of household financial stress that moves faster than most macro data.
5. Inequality in Balances: Directionally Correct

The claim that retirement savings are heavily stratified by income, and that outcomes differ significantly by race, is consistent with the Federal Reserve’s Survey of Consumer Finances and multiple EBRI and Vanguard studies, which consistently show large gaps in both plan access and account balances by income quartile and by race. We did not find a single authoritative figure to cite for “black and Hispanic households have almost no savings” as a blanket statement, and would caution against a claim that specific — the accurate, defensible version is that median retirement account balances for Black and Hispanic households are a small fraction of the median for white households, a gap driven primarily by differences in access to employer plans and income, not by differences in savings behavior conditional on access.
6. Medicare Gaps and Long-Term Care Risk: Correct, Understated if Anything
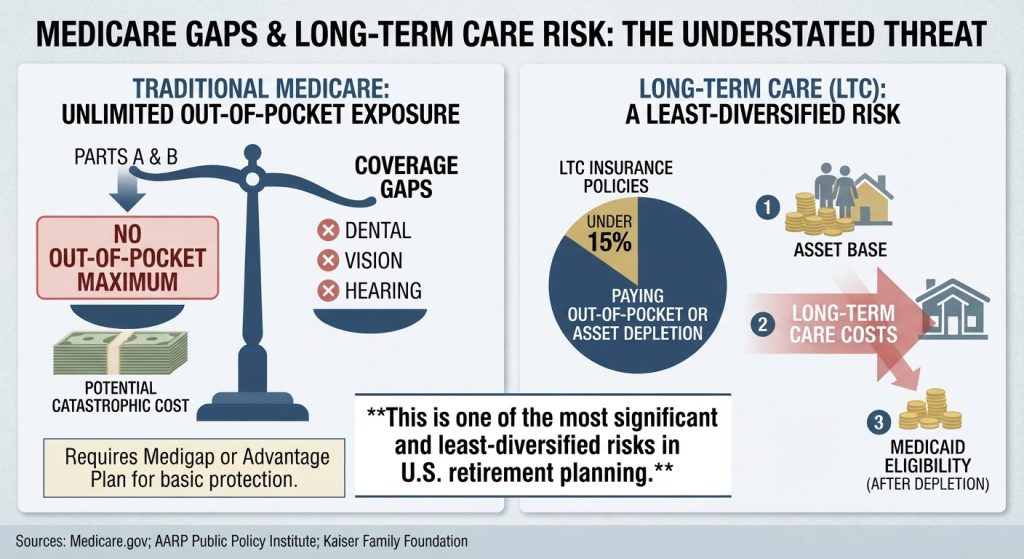
This is well-established and, if anything, understated in the original framing. Traditional Medicare has no out-of-pocket maximum for Parts A and B, no dental/vision/hearing coverage, and requires either a supplemental (Medigap) policy or Medicare Advantage plan to control exposure. Long-term care insurance take-up in the U.S. is low (well under 15% of retirees carry a policy), which means most long-term-care costs are paid out of pocket or shifted to Medicaid only after assets are substantially depleted. This is one of the most economically significant, least-diversified risks in U.S. retirement planning.
7. Complexity and Low Financial Literacy: Consistent With Survey Data
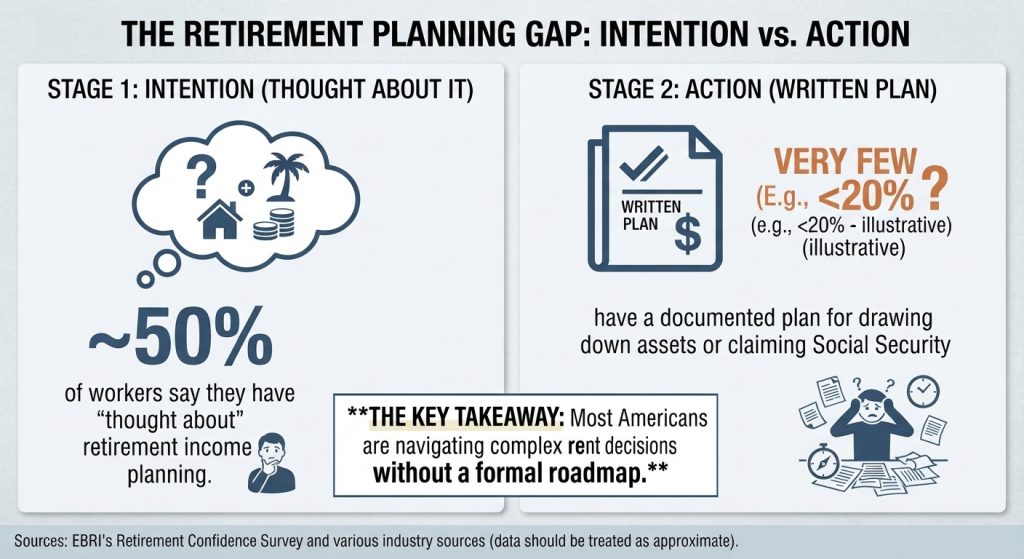
Surveys from EBRI’s Retirement Confidence Survey and various industry sources consistently find that roughly half of workers say they have “thought about” retirement income planning but do not have a written or documented plan for drawing down assets or claiming Social Security. This claim is directionally well-supported, though exact percentages vary by survey methodology and should be treated as approximate rather than precise.
8. Retirement Age vs. Reality: Well-Documented

This is a long-standing and well-documented finding in retirement research (notably from the Employee Benefit Research Institute’s annual surveys): a majority of workers expect to retire around 65, but a meaningful share actually stop working earlier than planned, most commonly due to health problems or job loss, not choice. This mismatch compresses the accumulation period and extends the drawdown period simultaneously — a structural risk regardless of a household’s savings discipline.
The Bigger Picture

None of these eight points is fabricated, and most are confirmed almost exactly as described. The corrections worth making are about precision, not direction: the Social Security depletion date is sooner than commonly stated (early 2030s, not mid-to-late), the replacement-rate shortfall is a mandatory-scheme gap that voluntary savings substantially — if unevenly — close, and the inequality claims are correct in direction but should be stated as relative gaps rather than absolute figures without a citable source.

The consistent theme, which is the point most U.S.-based retirement economists actually emphasize, is that each of these eight problems is a symptom of the same design decision: the U.S. transferred the risk of under-saving from the state to the individual decades ago, when defined-benefit pensions gave way to 401(k)s. That trade produced the deepest pool of private retirement capital in the world — and, mechanically, produced every one of the coverage, adequacy, leakage, and inequality gaps documented above. Fixing any one symptom without addressing that underlying allocation of risk — through broader mandatory coverage, Social Security’s revenue shortfall, or both — will only shift the pressure elsewhere in the system.
Sources: U.S. Bureau of Labor Statistics, National Compensation Survey (March 2025); Social Security Administration, 2026 Annual Trustees Report; Vanguard, How America Saves 2026; OECD, Pensions at a Glance 2025; Northwestern Mutual, 2024–2026 Planning & Progress Studies; Employee Benefit Research Institute, Retirement Confidence Survey.
SSA 2026 Trustees Report : https://www.ssa.gov/OACT/TR/2026/?utm_source=chatgpt.com
National Institute on Retirement Security : https://www.nirsonline.org/research/retirementinamerica2026/
BLS National Compensation Survey : https://www.bls.gov/ebs/publications/employee-benefits-in-the-united-states-march-2025.htm?utm_source=chatgpt.com, https://www.bls.gov/news.release/archives/ebs2_09252025.htm?utm_source=chatgpt.com, https://www.bls.gov/news.release/ebs2.t01.htm?utm_source=chatgpt.com
Committee for a Responsible Federal Budget, CBPP, Bipartisan Policy Center : https://www.influencewatch.org/non-profit/committee-for-a-responsible-federal-budget-crfb/
Vanguard How America Saves 2026 : https://workplace.vanguard.com/content/dam/inst/iig-transformation/has/2026/pdf/HowAmericaSaves2026.pdf
Federal Reserve Survey of Consumer Finances, EBRI : https://www.ebri.org/docs/default-source/fast-facts-%28public%29/ff-511-iaraceethnicity-22aug24.pdf?sfvrsn=4e0072f_3&utm_source=chatgpt.com