
A Fact-Check of the Global Rankings
A data-grounded look at where the U.S. retirement system really stands — and why the numbers tell a more complicated story than “middle of the pack.”
Is America prepared for retirement? A popular claim circulating online holds that the United States ranks somewhere in the “middle to lower-middle” tier of global retirement systems — behind the Netherlands, the Nordics, and even Canada and the U.K. The claim is broadly accurate, and the two indexes it typically cites check out under scrutiny. But a few of the specifics are worth tightening, and the more interesting story — the one a Western economist would actually emphasize — is less about America’s rank and more about the peculiar, high-variance design of its system.
1. Is America Prepared for Retirement? The Rankings, Verified
Mercer CFA Institute Global Pension Index (2025), 52 countries. The U.S. system scored 61.1 out of 100, a C+ grade, placing it 30th of 52 — a fact confirmed directly in Mercer and CFA Institute’s own release. The Netherlands (85.4), Iceland (84.0), Denmark (82.3), Singapore (80.8) and Israel (80.3) hold the five A grades. The U.S. sits behind the U.K. (72.2), Canada (70.4) and Australia (77.6), but ahead of Poland (57.0) and well ahead of India (43.8), the lowest-scoring system in the index.

Mercer CFA Institute Global Pension Index 2025 ranking showing US retirement system score
Breaking the U.S. score into its three components is more informative than the headline number: Adequacy 64.1, Sustainability 59.9, Integrity 58.0. In other words, the U.S. system’s weakest link isn’t how much retirees currently receive — it’s whether the system can keep paying at that level (sustainability) and how well-governed and transparent it is (integrity). That is a materially different diagnosis than simply “underfunded,” and it lines up with a common critique from U.S.-based economists: Social Security’s trust fund trajectory, not current benefit generosity, is the real long-term risk.
Natixis Global Retirement Index (2025), 44 countries. The U.S. ranked 21st, with an overall score of 70%, up one spot from 22nd in 2024 but down sharply from 15th a decade ago and a peak of 14th in 2016. Norway topped the list, followed by Ireland, Switzerland, Iceland and Denmark.
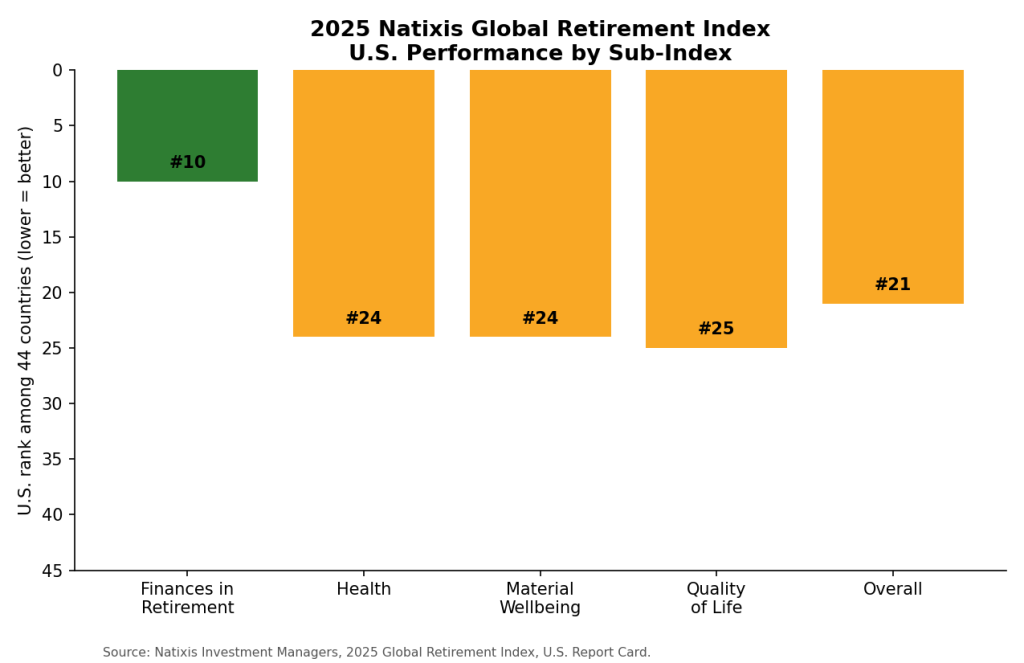
Natixis Global Retirement Index 2025 U.S. sub-index breakdown
The sub-index breakdown is the real story here, and it supports a specific, falsifiable claim: the U.S. is not “mediocre across the board” — it is bifurcated. It ranks a strong 10th in Finances in Retirement (helped by a falling tax burden as a share of GDP, from 27% to 25%), but only 24th in Health, 24th in Material Wellbeing, and 25th in Quality of Life, the last of these dragged down by falling happiness scores, particularly among younger cohorts, and worsening income inequality (39th on that specific measure).
2. Where the Original Framing Needs Correction
Most of the underlying figures in circulation are accurate. Two points, however, deserve sharper treatment than “the U.S. is below average across the board”:

- The replacement-rate comparison is directionally right but incomplete. The OECD’s Pensions at a Glance 2025 shows the U.S., when only mandatory public and private schemes are counted, delivers a net replacement rate around 39% for a full-career average earner — well below the roughly 63% OECD average from mandatory schemes. That supports the “behind the OECD average” claim. But the OECD also finds that voluntary savings — 401(k)s and IRAs — add more to the U.S. replacement rate than in almost any other country (an estimated 30–35 percentage points), pushing the effective total closer to 70%. The honest description is not “the U.S. falls short of the OECD average” but “the U.S. has chosen to make roughly half its retirement income voluntary, which is both its greatest source of upside and its greatest source of inequality between savers and non-savers.”
- Sustainability and integrity are not simply “low” — they are the specific components dragging the U.S. below the A/B+ tier, while adequacy is comparatively closer to average. This is a more precise (and more policy-relevant) claim than a blanket “below average on everything.”
3. A Western Economist’s Reading
Economists who study retirement systems (works from the OECD Secretariat, the Wharton Pension Research Council, and Brookings’ retirement security program make this point regularly) tend to frame the U.S. case not as a failing system but as a high-variance one. Three structural features explain most of the gap with top-ranked countries:

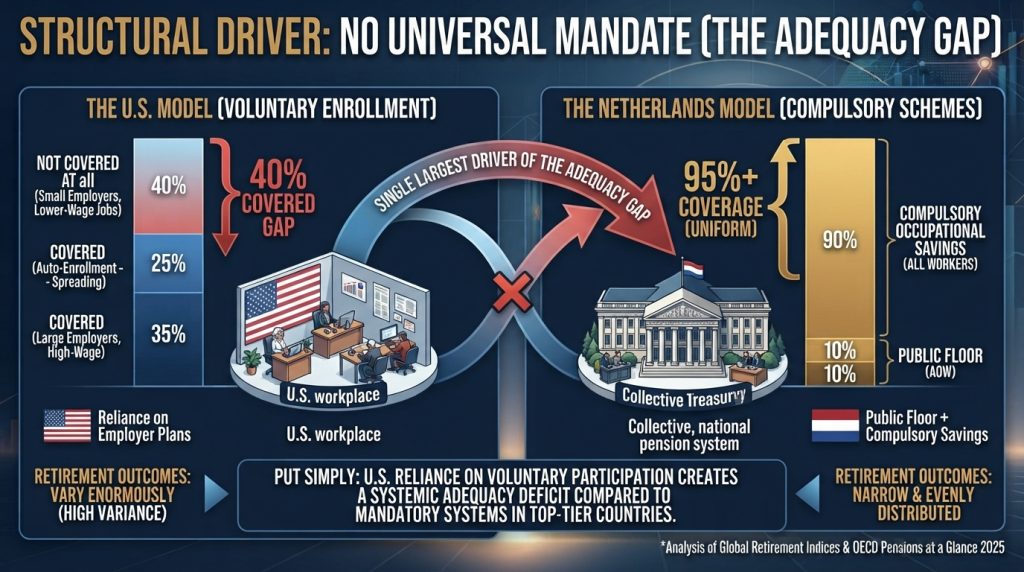
No universal mandate. Countries at the top of the Mercer index — the Netherlands, Denmark, Singapore, Australia — combine a public floor with compulsory private or occupational savings. The U.S. relies on voluntary enrollment in employer plans; even with auto-enrollment spreading, a meaningful share of workers, especially at small employers and in lower-wage jobs, are not covered at all. This is the single largest driver of the “adequacy gap” between the U.S. and the Netherlands.
A funding gap in the public pillar. Social Security’s trustees have projected trust fund depletion within roughly a decade if Congress does not act, at which point incoming payroll taxes would cover only about three-quarters of scheduled benefits. That prospective shortfall — not current benefit levels — is what depresses the U.S. “sustainability” score in the Mercer index and is the reform issue most frequently cited by U.S. economists across the political spectrum.

Inequality embedded in a voluntary system. Because the U.S. model leans on market participation, outcomes vary enormously by income, employer, and financial literacy — which is precisely why the U.S. can rank 10th in aggregate “Finances in Retirement” (reflecting strong capital markets and household balance sheets in aggregate) while ranking in the mid-20s on Material Wellbeing and Quality of Life, which are more sensitive to distributional and everyday-cost pressures. A country like Denmark or the Netherlands, by contrast, compresses that variance through mandatory participation, producing a narrower but more evenly distributed outcome — the classic equity-versus-flexibility tradeoff in pension design.

Put simply: the American system is not badly designed so much as it is unevenly designed. It produces excellent outcomes for disciplined, high-income savers with access to employer plans, and mediocre-to-poor outcomes for everyone else — a dispersion that a single composite ranking necessarily flattens.

4. What This Means in Practice
None of this is an argument against systematic saving — if anything, it strengthens the case for treating retirement planning as something the individual, not the system, must actively engineer:

- Maximize the employer match first. It is the only guaranteed, risk-free return available in the system.
- Target a savings rate in the mid-teens (as a percentage of income) or higher, since the U.S. floor (Social Security) is intentionally partial, not comprehensive, by international standards.
- Treat Social Security as a base, not a plan. The trust fund’s finite horizon is a known, published risk — plan around a possible future benefit reduction rather than assuming the status quo.
- Diversify vehicle types (401(k)/IRA, taxable brokerage, HSA) to manage the tax and liquidity risk that comes with a voluntary, market-linked system.
Bottom Line

The claim that the U.S. sits in the “middle-to-lower-middle” of global retirement rankings holds up: 30th of 52 in the Mercer Index, 21st of 44 in the Natixis Index, behind Canada, the U.K., Australia and the Nordic countries in both. But the more useful framing — the one an economist would lead with — isn’t the rank itself. It’s that the U.S. system trades a weak universal floor for a large voluntary upside, which is exactly why its retirement outcomes are so much more unequal, and so much more dependent on individual behavior, than in the countries that consistently outrank it.
This is the first part of a five-part series — Part 2 breaks down eight specific structural cracks behind this ranking, and Part 5 covers where to actually put your retirement savings.
Sources: Mercer CFA Institute Global Pension Index 2025 (Mercer/CFA Institute, released October 15, 2025); Natixis Investment Managers 2025 Global Retirement Index and U.S. Report Card (released September 9, 2025); OECD, Pensions at a Glance 2025 (November 2025).
Mercer CFA Institute Global Pension Index 2025 : https://insightcommunity.mercer.com/api/v1/uploads/2527187A_GL_MER_2025_Global_Pension_Index_Supplementary_report_Final_5907b61252.pdf?public=true
Natixis Global Retirement Index 2025: https://www.im.natixis.com/en-us/insights/investor-sentiment/2025/global-retirement-index#:~:text=Norway%20has%20regained%20the%20top%20position%20in%20the,in%20health%20outcomes%2C%20low%20unemployment%20and%20high-income%20equality.
OECD Pensions at a Glance 2025 : https://www.oecd.org/content/dam/oecd/en/publications/reports/2025/11/pensions-at-a-glance-2025_76510fe4/e40274c1-en.pdf